 Moolish
Learn · TD Sequential
What is TD Sequential? Tom DeMark's 9-13 explained
Last updated:
TD Sequential is a bar-counting method created by Tom DeMark that flags possible trend exhaustion. It runs in two phases: a setup that counts to 9 and a countdown that counts to 13. A completed count says a move has run for a defined length. It is not a confirmed reversal and it is not a trade signal.
If you have seen “TD9”, “the 13” or “a DeMARK 13” on a chart and wondered what the numbers under the bars mean, this page defines each one. It states the main counting rules, shows them in two drawings, lists the terms you will meet, and says plainly what the counts do not do. Where sources describe a rule differently, the page says so instead of picking one.
Who created it
TD Sequential was developed by Tom DeMark, a market technician who spent decades building timing tools. He set the method out in his 1994 book The New Science of Technical Analysis, published by John Wiley & Sons. Publisher and retailer listings give slightly different publication months for that year, so this page cites only the year. The book also covers other DeMARK tools, which is why you will see “DeMARK indicators” used as a family name.
Today DeMARK Analytics sells the official indicators and holds the brand. Many charting platforms and independent authors have written their own versions of the counts from public descriptions, and those versions can differ in small details. That is the reason this page keeps repeating “check the rule your tool uses”.
Moolish is not affiliated with, endorsed by or sponsored by Tom DeMark or DeMARK Analytics. TD Sequential is their method. Moolish’s own implementation of these counts is called Sequencer 9-13.
The two phases
The method has two phases that run one after the other. The setup counts to 9 and looks for a run of bars that has gone one way for a defined length. The countdown counts to 13, can only start once a setup has completed, and looks for a longer, patient version of the same idea. Each phase has a buy version and a sell version that mirror each other.
Setup: nine consecutive closes
The TD9 indicator explainer covers this phase on its own. A setup compares each bar’s close with the close four bars earlier. For a buy setup, the close must be lower than the close four bars before it, and this must hold for nine bars in a row. For a sell setup, the close must be higher than the close four bars earlier, nine bars in a row. If one bar breaks the run, the count resets and starts again from zero. DeMark’s description places a price flip before bar 1: one close above the close four bars earlier, then the first close below it starts the count.
Now the naming trap. A buy setup is built from a falling run of closes, because the method is looking for a downtrend that may be running out of steam. A sell setup is built from a rising run. The word “buy” names the kind of exhaustion being flagged, not an instruction to buy. Readers invert this all the time, and it is the most common source of confusion.
Perfection: bar 8 or 9 against bars 6 and 7
Not every completed setup is treated equally. A buy setup is called perfected when the low of bar 8 or bar 9 is below the lows of bars 6 and 7 (DeMARK’s word is “exceeded”). A sell setup is perfected when the high of bar 8 or bar 9 is above the highs of bars 6 and 7. The idea is that the end of the run should push a little beyond the bars just before it. Some sources write the rule as “8 and 9” instead of “8 or 9”, so check which version your tool uses before comparing two charts.
The perfected setup explainer has a worked example and the variants. A setup that is complete but not perfected is still a setup. Practitioners who rely on perfection tend to wait for it, or to treat the imperfect case as weaker, but that is a choice about how to read the count, not part of the counting itself.
Countdown: thirteen qualifying closes
The TD Countdown 13 explainer covers this phase on its own. After a setup completes, the countdown begins. Bar 9 of the setup can itself be countdown bar 1 when its close passes the countdown test; Sequencer 9-13 counts it that way. For a buy countdown, a bar qualifies when its close is at or below the low of the bar two bars earlier. For a sell countdown, a bar qualifies when its close is at or above the high of the bar two bars earlier. Qualifying bars do not have to be consecutive, so a countdown can pause while bars that fail the test go by, and it often takes far longer than the setup did.
Counting styles differ at the edges. A strict count requires the close to be strictly beyond the reference bar. A lenient count lets an equal value pass. Both versions exist in published descriptions and in charting tools, and this page does not call either one the correct one. Many descriptions also add a test on the thirteenth bar, comparing it with bar 8 of the countdown: for a buy, the low of the 13 bar is at or below the close of the 8 bar. A 13 that fails the test is called non-qualified. Read your tool’s documentation for the exact version.
TDST (TD Setup Trend)
TDST is a price level taken from the extreme of a completed setup. Practitioners use it as a reference line: a level where price has responded before, and a line whose break or hold they watch. Descriptions usually take the highest true high among the setup bars for a buy setup, drawn as resistance, and the lowest true low for a sell setup, drawn as support. We found no primary text that spells out the direction, so treat it as the common description.
DeMARK’s own description takes the highest true high of a buy setup and the lowest true low of a sell setup, and charting tools differ in how they read “true” high and low. If your TDST line does not match another chart, this is the first thing to check. Treat the level as a reference for reading price, not as a forecast. The TDST explainer goes deeper, and the strategy page shows how traders fit the counts into a reading routine.
What a 9 means and what a 13 means
The two numbers answer different questions. A 9 says that a short run of bars has been consistently one-sided. A 13 says that the market spent a long, patient stretch closing at or beyond the level from two bars earlier, again and again. Neither says what happens next.
| Aspect | Setup 9 | Countdown 13 |
|---|---|---|
| What it records | Nine consecutive closes against the close four bars earlier | Thirteen qualifying closes against the high or low two bars earlier |
| Bars must be consecutive | Yes | No |
| How often it appears | Often, especially on short timeframes | Much less often, because it must run to the end first |
| What it suggests | A short-term run may be stretched | A longer move may be exhausted |
| What it does not say | That price will reverse, or when | That price will reverse, or when |
Terms you will meet
DeMARK’s own materials use a specific vocabulary. These are the terms you are most likely to see, with one-line meanings. They are DeMARK’s terms, and tools that reimplement them may handle edge cases differently.
| Term | One-line meaning |
|---|---|
| Setup | The first phase: nine consecutive closes against the close four bars earlier. |
| Perfected setup | A completed setup whose bar 8 or 9 extends beyond bars 6 and 7. See perfected setup. |
| Countdown | The second phase: thirteen qualifying closes counted after a setup completes. |
| TDST | The reference level drawn from the extreme of a setup. |
| Recycling | A countdown restarting when a fresh setup in the same direction completes before it has finished. |
| Cancellation | A countdown being dropped, for example when a setup in the opposite direction completes. |
| Risk level | A price level beyond the extreme of the counted bars, past which the exhaustion read is no longer considered valid. |
Descriptions of recycling, cancellation and the risk level vary the most between sources. For the other terms, the glossary gives the definitions Moolish uses.
Reading counts on crypto charts
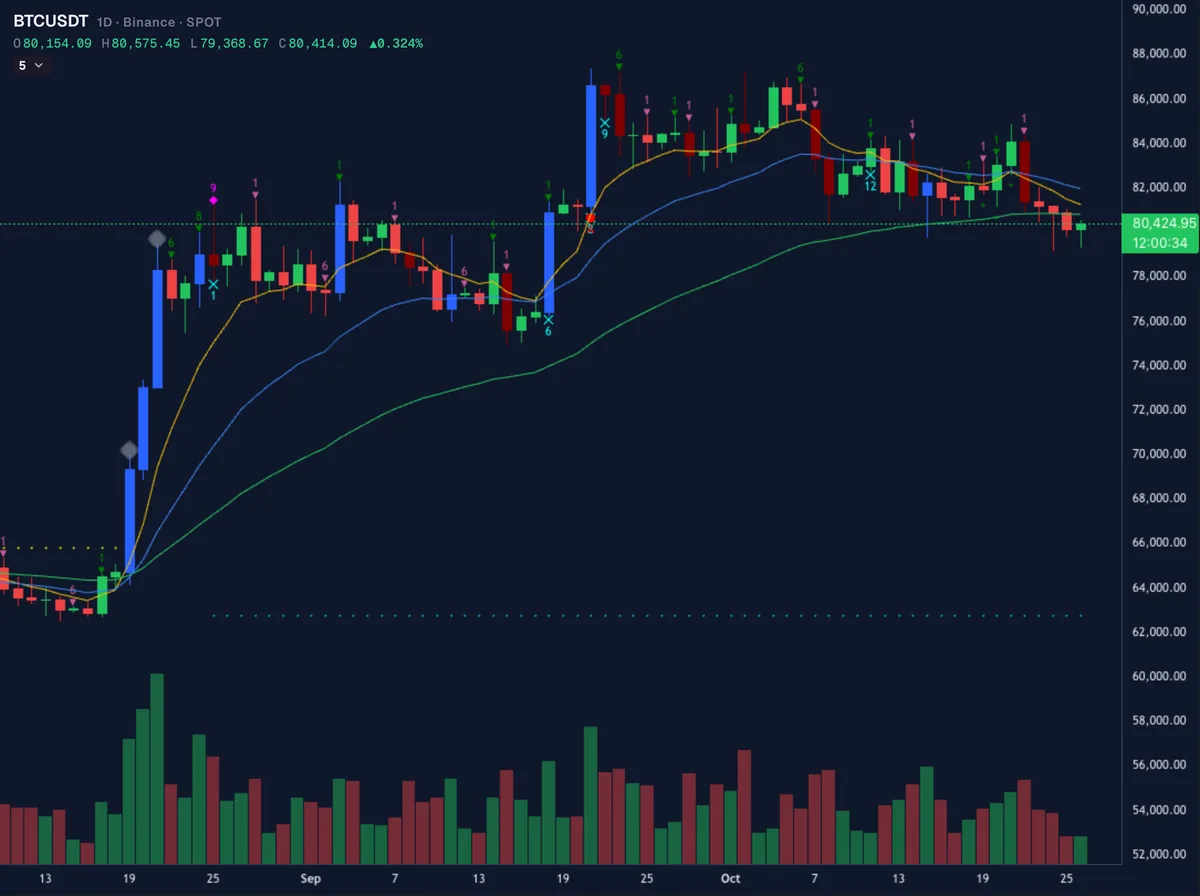
The counting rules do not care about the asset. What changes on crypto is the calendar. Crypto trades around the clock, so there is no overnight gap and no weekend gap, and every bar of a timeframe has the same length. A run of nine daily bars is nine calendar days, including Saturdays and Sundays. A stock chart skips weekends, so the same nine bars cover a longer stretch of calendar time.
The one detail to check is when a bar ends. A daily bar closes at the venue’s bar boundary, and venues can use different boundaries. Moolish daily bars open at 00:00 UTC and weekly bars open on Monday at 00:00 UTC. If you compare counts between platforms and they disagree by a bar, the bar boundary is a likely cause, so check your venue’s setting before you decide a tool is wrong.
What the counts do not do
- They are not a timing tool. A completed 9 or 13 does not say when anything will happen. Price can continue in the same direction for many more bars.
- They give no direction on their own. A buy setup flags a stretched decline. It does not tell you the market will rise.
- They give no stop and no size. The count says nothing about where you are wrong or how much to risk.
- They repeat in strong trends. In a persistent move, new setups can complete again and again while the trend keeps going.
- A timeframe changes the meaning. A 9 on the 15M chart and a 9 on the 1W chart use the same arithmetic, but the weekly one spans months of trading and many more participants. They are not equivalent.
- Counts can stall. A countdown may never reach 13, or may be cancelled first. Some completed counts are followed by nothing notable.
None of this makes the method useless. It makes it a way to find charts worth a closer look, which is a smaller claim than “a signal”. Nothing on this page is financial advice.
Common misreads
- Inverting buy and sell. A buy setup follows falling closes. It flags exhaustion of a downtrend. It is not an order to buy at any price.
- Counting from any bar. A setup needs nine consecutive qualifying closes. Starting a count from a bar you like, or skipping a bar that broke the run, gives a number that no tool would produce.
- Treating a 9 as a signal. A 9 is a defined length of run, not a prediction. The same is true of a 13.
- Mixing up TD Sequential and the DeMarker. The DeMarker (DeM) is a different oscillator. It does not use setups or countdowns.
- Mixing up setup and countdown numbers. A 9 belongs to the setup and a 13 to the countdown. They are separate counters and a countdown does not exist until a setup has completed.
Scanning for counts instead of reading every chart
Counting by hand across hundreds of charts is slow, and a bar that closed while you were away is easy to miss. Moolish scans 1,600+ crypto markets for these counts with its Sequencer 9-13 method, on ten timeframes from 15M to 3M. You pick the signal, such as Buy Setup 9, and the timeframe, and the scanner lists the markets where it has just appeared on a closed bar.
Sequencer 9-13 counts from the first qualifying close and resets on the first bar that fails; it does not wait for a separate flip bar. The engine records the close of countdown bar 8 for the 13-versus-8 comparison. It does not compute perfection, so Moolish reports the count only.
You can also add volume and candle conditions on other timeframes to narrow the list. The scanner reports what the rules detect. It does not tell you what to trade. The TD Sequential crypto scanner guide walks through the signals and the setup step by step.
FAQ
What is Tom DeMark’s TD Sequential indicator?
TD Sequential is a price-exhaustion method created by Tom DeMark and set out in his 1994 book The New Science of Technical Analysis. It has two parts: a TD Setup of nine consecutive closes compared with the close four bars earlier, and a TD Countdown of thirteen qualifying closes. A completed count flags possible exhaustion, not a confirmed reversal.
What does DeMARK 13 mean?
A DeMARK 13 is a completed TD Countdown. After a valid nine-count setup, thirteen closes have met the countdown test, not necessarily in a row. For a sell, each close is at or above the high two bars earlier; for a buy, at or below the low. It marks possible exhaustion, not a confirmed reversal.
How does TD Sequential work?
Two phases run in order. The setup counts nine consecutive closes against the close four bars earlier. Once the setup completes, the countdown counts thirteen qualifying closes against the high or low two bars earlier. Buy and sell versions mirror each other. Traders usually look for other evidence before acting on a count.
What is TD9?
TD9 is the setup on its own: a completed run of nine consecutive closes, each compared with the close four bars earlier. It marks a possible turn in a short run of bars. The countdown to 13 is a separate step that can only begin after the setup has finished, so a TD9 alone is not a full sequential count.
Is TD Sequential the same as the DeMarker indicator?
No. The DeMarker (DeM) is a separate oscillator that compares each bar’s highs and lows with the previous bar’s and scales the result between zero and one. TD Sequential counts bars in a setup and a countdown. The similar names invite confusion, but they are different tools with different rules.
Is TD Sequential available on TradingView?
Scripts that draw TD Sequential counts exist on TradingView, both public and paid, written by independent authors. Each script implements its own version of the rules. Check the script’s description for how it counts perfection, strict or lenient countdowns and bar boundaries before comparing it with another chart. This page does not claim a built-in version.
Ask an AI to check this page