 Moolish
Part 5 of 8 in TD Sequential
Learn · TD Sequential
TD Sequential strategy: how traders read the 9 and the 13
Last updated:
There is no single TD Sequential strategy. Traders treat a completed 9 or 13 as a prompt to inspect the chart, then judge it against the larger trend, volume, price levels such as TDST, and a plan for being wrong. This page lays out that reading routine as practice, not as a system with promised results.
If you only want the definitions, start with what TD Sequential is. This page assumes you know what a 9 and a 13 are and asks the next question: what do you do when one appears? The honest answer is that the count starts your analysis and does not finish it.
Moolish is not affiliated with, endorsed by or sponsored by Tom DeMark or DeMARK Analytics. TD Sequential, TDST and TD Perfected Setup are terms from their method. Moolish’s own implementation of the counts is called Sequencer 9-13.
Why the count is a starting point
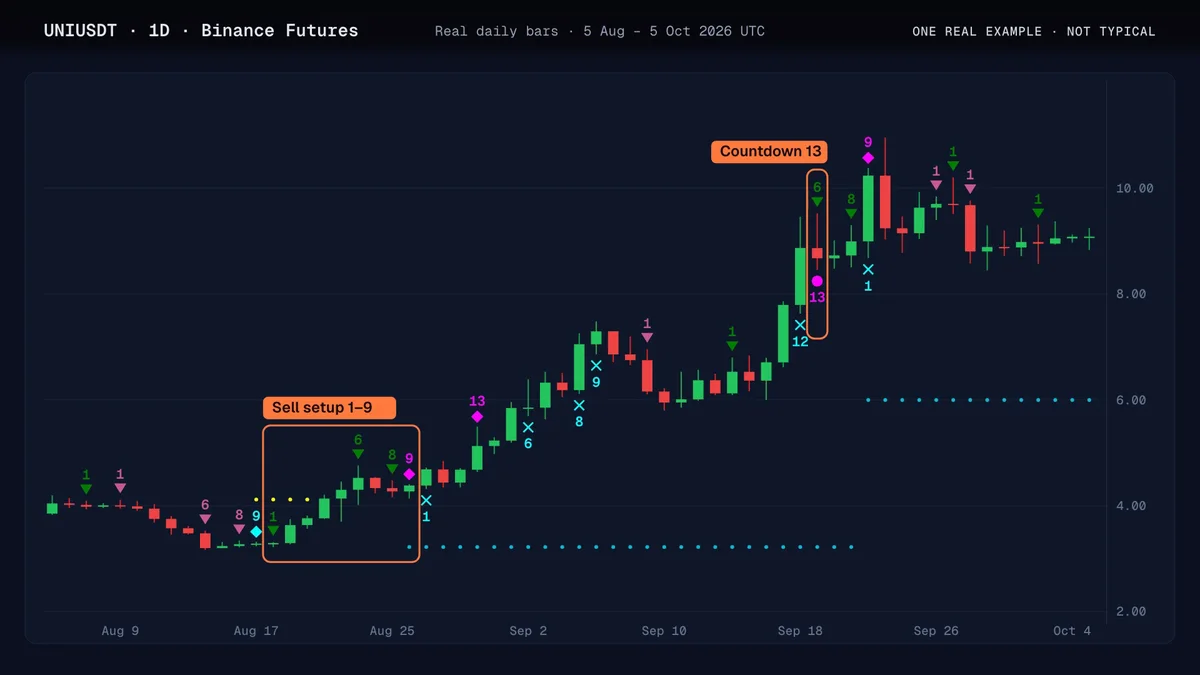
A buy setup 9 says nine closes in a row each finished below the close four bars earlier. A countdown 13 says thirteen bars met a closing test over a longer stretch. Both describe how long a move has lasted. Neither says why price moved, how many participants are left, or when the move stops.
That is why strategy talk around the method is really talk about context. The same 9 means different things in a strong trend, in a range and after a sharp shock. Most of the useful work happens before and after the number appears.
A reading routine in six questions
The routine below is a way to organise your attention. It is not a rule set that has been shown to work, and it is not the only reasonable order. Change it to fit your own style, and write down what you chose so you can review it later.
1. Which timeframe, and what is above it?
Pick the timeframe you actually trade on, then open the one above it. A 9 on the 4H chart inside a daily downtrend reads differently from a 9 on the 4H chart where the daily has already turned. Many traders put the count on the timeframe they act on and use the higher one only for context.
2. What was the trend into the count?
A buy 9 appears after a decline, a sell 9 after a rise. Ask how steep and how long the move was. A slow grind and a one-day collapse can both complete a 9. Because nine bars is a short run on most timeframes, a count inside a long trend may only mark a pause.
3. Is it a 9 or a 13?
The 9 appears often. The 13 appears much less often, because the countdown must run to the end without being cancelled, so a 13 describes a longer stretch of one-sided closes. Some readers give a 13 more weight for that reason, others treat both as the same kind of prompt. Either is a judgment about reading, not a counting rule. The countdown explainer covers what qualifies a 13.
4. What does volume say?
Volume tells you whether participation changed while the count completed. A completed buy 9 on rising volume is a different picture from one on thin volume. Neither is a verdict. If you want to scan for the combination, the volume and candle confirmation guide shows how to ask for it.
5. Where are the nearby levels?
Many readers draw a reference level from the extreme of the completed setup, the line known as TDST, and watch how price behaves around it. The TDST explainer covers the idea. Other traders use ordinary swing highs and lows, round numbers or prior ranges instead. What matters is that you know the level before you decide, not after.
6. Where would you be wrong?
The count gives no stop and no size. Before any decision, define the price at which your reading is no longer valid, and decide how much you can afford to lose if it fails. This step has nothing to do with TD Sequential, and it is the one that matters most when a count turns out to be a pause.
| Question | What you look at | What it cannot tell you |
|---|---|---|
| Timeframe | The count on your timeframe, the trend on the one above | Whether the higher timeframe will hold |
| Trend into the count | Length and steepness of the move | Whether the move is finished |
| 9 or 13 | How long the one-sided run lasted | Whether a longer run is more likely to reverse |
| Volume | Participation as the count completed | Who is trading, or why |
| Levels | TDST and your own swing levels | Whether a level will hold |
| Being wrong | A price and a size you chose in advance | Nothing; this one is yours to set |
Two common TD Sequential strategies
Published descriptions of the method split into two broad habits. They are habits, and this page does not rank them.
- As a warning that a move is stretched. The reader sees a 9 or 13 and stops adding to a position in that direction, or tightens a plan they already had. The count changes how they manage something they already hold.
- As a prompt to look for a turn. The reader sees a 9 or 13 and then waits for the chart to show something else, such as a level breaking, a change in volume or a candle shape, before doing anything. The count only raises the question.
In both cases the count is one input. Neither habit treats a number under a bar as an instruction.
What goes wrong most often
- Reading a buy 9 as an order to buy. The name describes the kind of exhaustion counted, a decline, and not what you should do.
- Acting on a 9 in a strong trend. New setups can complete again and again while a trend continues. A run of 9s in the same direction is a warning about that habit.
- Ignoring the timeframe. A 9 on the 15M chart and a 9 on the weekly chart use the same arithmetic but are different events.
- Comparing two charts that count differently. Tools vary on the flip bar, equal values and bar boundaries. If two charts disagree, find out why before deciding which is right. The TD Combo comparison shows how much detail varies even between DeMARK’s own methods.
- Judging the method on one trade. A single outcome, good or bad, says little. Without a written routine and a review of many cases, it is easy to remember the hits.
How to test a TD Sequential strategy
If you want evidence for yourself, write the routine down first, then scroll back through past charts and note what happened after each completed count, including the cases that went nowhere. Keep the timeframe fixed and include more than one market and more than one phase of the market. This is slow, and the result describes only the period and markets you checked. It does not predict the next one, and it is not a formal study with trading costs. Treat vendor charts, screenshots of successful counts and testimonials the same way: as illustrations, not as evidence.
Where scanning helps
A reading routine needs charts to read. Checking hundreds of markets by hand for a fresh 9 or 13 is slow, and a bar that closed while you were away is easy to miss. Moolish scans 1,600+ crypto markets for the TD Sequential counts on ten timeframes, from 15M to 3M, and detects each one on the closed bar. You can add volume and candle conditions on other timeframes to narrow the list.
The scanner reports what the rules detect, and it does not tell you what to trade. The advanced tool, including its support and resistance events, is inside the app: start the free 7-day trial (no credit card) to use it. If you would like to practise the counting first, the free TD Sequential count checker works on a symbol in your browser.
Nothing on this page is financial advice. Trading crypto carries a high risk of loss, and a completed count does not change that.
FAQ
What is the best TD Sequential strategy?
No source we read shows one best strategy. Traders use the 9 and the 13 as prompts, then judge them against the larger trend, volume, price levels and a plan for being wrong. Which routine suits you depends on your timeframe and risk. Test it on past charts yourself, and treat any claim of a best setup with caution.
Is a 13 stronger than a 9?
A 13 is rarer, because the countdown has to run to the end without being cancelled, and it describes a longer stretch of one-sided closes. Whether that makes it a stronger prompt is a reading choice, not a counting rule. Neither number gives direction or timing.
Can I trade a TD Sequential 9 on its own?
The method does not supply a stop, a size or a direction, so a 9 on its own leaves those decisions open. Most descriptions pair the count with other evidence, such as the higher timeframe, volume or a price level. Nothing here is financial advice.
Which timeframe works best for TD Sequential?
The counting arithmetic is the same on every timeframe, but the events are not equivalent. A weekly 9 covers nine weeks of trading and a 15M 9 covers a few hours. No source we read shows that one timeframe is better, so choose the one you act on and check the next one up.
How can I scan for TD Sequential counts across crypto?
Moolish scans 1,600+ crypto markets for Setup 9 and Countdown 13 on ten timeframes, from 15M to 3M, and detects each on the closed bar. The 7-day free trial needs no credit card. The scanner reports the count and does not tell you what to trade.
Sources
Read from each public page on the date shown. Check the page itself before you decide, because products and prices change.
- https://www.tradingview.com/script/gVMuxasg-DeMARK-9-13/, checked October 28, 2026. DeMARK 9-13 is a paid script that plots Setup, Countdown, TDST support and resistance lines, Perfected Setups and Risk Levels; the page says it helps identify potential market inflection points and that DeMARK indicators are not trading systems.
- https://www.wiley-vch.de/en/areas-interest/finance-economics-law/demark-indicators-978-1-57660-314-7, checked October 26, 2026. Listing for Jason Perl, DeMark Indicators (ISBN 978-1-57660-314-7), the book that sets out the DeMARK family of counts.
Ask an AI to check this page