 Moolish
Part 6 of 8 in TD Sequential
Learn · TD Sequential
TDST explained: the TD Setup Trend support and resistance levels
Last updated:
TDST, short for TD Setup Trend, is a support or resistance level drawn from the extreme of a completed TD Sequential setup. After a buy setup the level sits at the top of the nine bars and acts as resistance. After a sell setup it sits at the bottom and acts as support. Traders watch how price behaves at it. It is a reference line, not a forecast.
This page covers the general idea: how the level is anchored, how it is usually read, where descriptions differ, and what it cannot do. It assumes you know what a completed nine-bar setup is. For the wider method, see what TD Sequential is.
Moolish is not affiliated with, endorsed by or sponsored by Tom DeMark or DeMARK Analytics. TD Sequential, TDST and TD Perfected Setup are terms from their method. Moolish’s own implementation of the counts is called Sequencer 9-13.
What TDST is
A setup is nine consecutive closes pressing one way. TDST turns that run into a price level. The reasoning behind it is simple: the run of bars marks the territory where the move happened, and its far edge is where the opposite side last held the market. If price later returns to that edge, how it behaves there is what readers care about.
The name describes the idea. It is a level taken from the Setup, and it is used to judge the Trend. It is not a moving average, it does not move with each bar, and it is not an oscillator. It is a flat line that stays where it was drawn until it is replaced or retired.
How the level is anchored
The common description works like this.
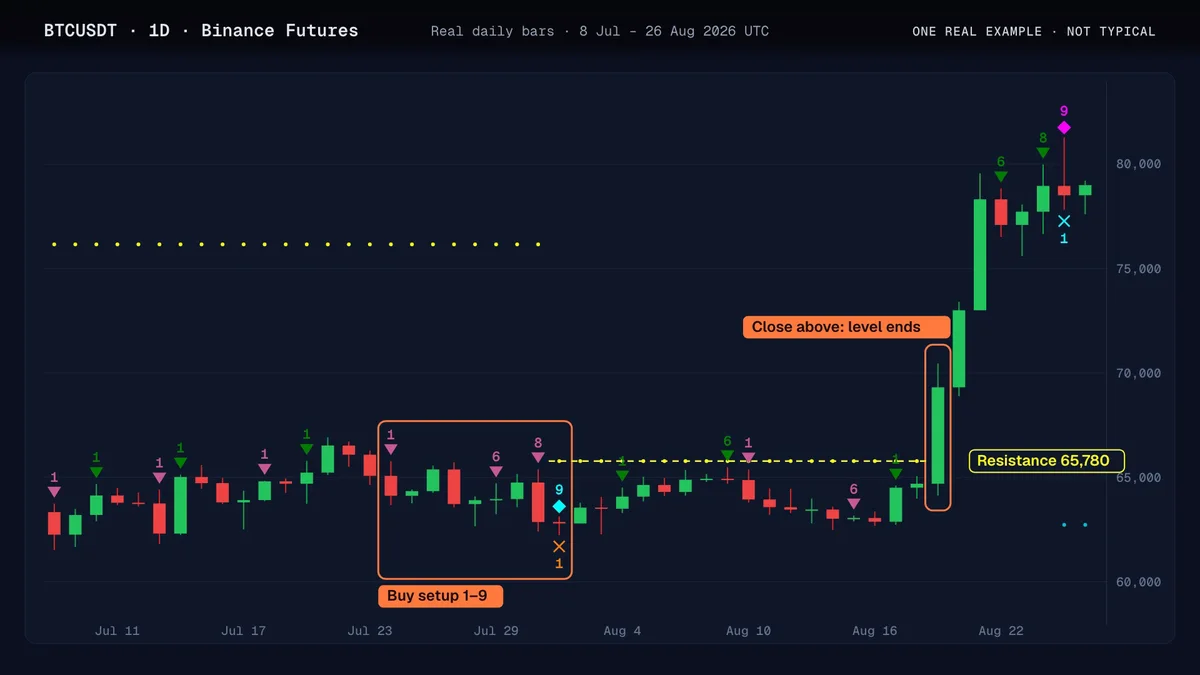
- After a buy setup (nine falling closes), the level is the highest true high among the setup bars. It is drawn as resistance, a ceiling above price.
- After a sell setup (nine rising closes), the level is the lowest true low among the setup bars. It is drawn as support, a floor below price.
A true high is the higher of the bar’s high and the previous bar’s close, and a true low is the lower of the bar’s low and the previous bar’s close. The difference only shows up when a bar gaps away from the one before it. On markets that trade around the clock there are fewer gaps, so the plain high and low often give the same number.
How traders read it
The level is a place to ask a question, not a place to act. These are the readings that appear most often in published descriptions.
| What price does | How it is commonly read | What to keep in mind |
|---|---|---|
| Rises to the level and turns back | The level held, and the pressure of the earlier move is still present | One touch is one observation, not a pattern |
| Closes beyond the level | The pressure that built the setup has eased | Check how many closes and by how much; a marginal close can reverse |
| Spends time around the level | The market is deciding; wait for evidence | Choppy price near a line gives mixed signals |
| Never returns to the level | The line stays as a reference and is eventually replaced | An old level far from price carries little information |
Notice that every reading ends with a caveat. A line can only tell you where price behaved a certain way before. Support and resistance of any kind are ideas about crowd behaviour, and crowds do not have to repeat themselves.
Where descriptions differ
TDST is one of the parts of the method where published descriptions and charting tools differ most. Before you compare a line on one chart with a line on another, check these points.
- The anchor bars. The common description takes the extreme of all nine setup bars. DeMARK’s TradingView script draws it from the extremes of the completed 9, and other tools may anchor it differently, so numbers can differ.
- True range or plain range. Some tools use the true high and true low, some use the bar’s own high and low. On gap-free markets the difference is small.
- Qualification. Some tools distinguish qualified from disqualified levels. DeMARK’s TradingView script, for example, draws qualified lines solid and disqualified lines dashed when its Breakout Qualifiers setting is on.
- How many levels to keep. A new setup in the same direction can replace the last level or sit alongside it, depending on the tool.
- When a level is retired. Descriptions differ on when a level stops being relevant.
None of these is the one correct answer. If two charts disagree, work out which choice each tool makes rather than deciding that one of them is broken.
TDST and the other parts of the method
TDST connects to the rest of the counts in two ways, and descriptions vary on the detail of both, so read your tool’s documentation.
First, it can interact with the countdown. Some descriptions let a break of the level affect whether a countdown continues, is cancelled or is recycled. The countdown explainer covers the countdown itself.
Second, it can help with the question of where you would be wrong. A level gives you a concrete price to reference, which is more useful than a number under a bar. The strategy page sets this out as part of a reading routine.
Perfection is a separate idea. The perfected setup explainer covers the bar-8-or-9 test that some readers apply to the same nine bars.
What TDST does not do
- It does not predict. A level is a reference for reading price, and price can cross it, ignore it or stall at it.
- It does not give a stop or a size. You still choose where you are wrong and how much to risk.
- It is not unique. Many traders draw ordinary swing highs and lows that coincide with it, or sit nowhere near it.
- It depends on the timeframe. A level drawn from nine daily bars and one from nine 15M bars are different things, with different weight.
- Different tools draw different lines. Compare the rules before comparing the lines.
Seeing the levels in practice
On a chart the idea is easiest to see by looking at a completed setup and the line that comes from it, then watching what price does later. The free TD Sequential count checker lets you check a symbol’s counts in your browser first.
Moolish’s Sequencer 9-13 method includes support and resistance events, which you can scan for across 1,600+ crypto markets on ten timeframes from 15M to 3M. The details live in the app, the advanced tool: sign up for the free 7-day trial (no credit card) to use it. The scanner reports what its rules detect and does not tell you what to trade.
Nothing on this page is financial advice. Trading crypto carries a high risk of loss.
FAQ
What does TDST mean?
TDST stands for TD Setup Trend. It is a support or resistance level taken from the extreme of a completed TD Sequential setup. After a buy setup it is drawn as resistance at the top of the nine bars, and after a sell setup as support at the bottom. It is a reference line, not a prediction.
How is the TDST level calculated?
The common description takes the highest true high of the nine setup bars after a buy setup and the lowest true low after a sell setup. Some tools use plain highs and lows instead, or anchor differently. Check which rule your tool uses before comparing two charts.
Is TDST the same as support and resistance?
It is a specific kind. Ordinary support and resistance come from any swing high or low you choose. TDST comes from a defined rule applied to a completed setup, so two traders using the same rule and data will draw the same line. Whether price respects it is a separate matter.
Does a break of TDST mean the trend has reversed?
No. A close beyond the level is commonly read as the earlier pressure easing, and it is one observation. Price can close beyond the line and return, or stay beyond it briefly. Check the size and the number of closes, and look at other evidence before drawing conclusions.
Does Moolish show TDST levels?
Sequencer 9-13 includes support and resistance events from completed setups, which you can scan for in the app. They are Moolish’s own events and are not guaranteed to match a DeMARK TDST line. The details are in the app, free for 7 days with no credit card. Moolish is not affiliated with Tom DeMark or DeMARK Analytics.
Sources
Read from each public page on the date shown. Check the page itself before you decide, because products and prices change.
- https://www.tradingview.com/script/gVMuxasg-DeMARK-9-13/, checked October 28, 2026. DeMARK's script describes TDST as derived from the Setup phase and used to check whether trends hold: resistance lines are drawn from the highest true high of a completed 9 Buy Setup and support lines from the lowest true low of a completed 9 Sell Setup. With Breakout Qualifiers on, a dashed line means disqualified and a solid line means qualified.
- https://github.com/ourarash/tdsequential, checked October 26, 2026. An MIT-licensed Node.js package that returns per-bar setup and countdown counts and flags including perfection and TDST levels; it does not mention scanning or alerts.
Ask an AI to check this page